|
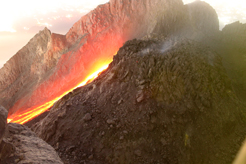
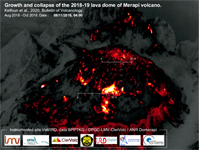
Movie of the complete growth of the 2018-2019 lava dome of Merapi volcano (Indonesia) done from thermal images of Somerapi1. |
 |
|
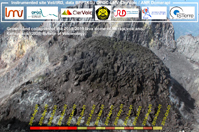
Movie of the complete growth of the 2018-2019 lava dome of Merapi volcano (Indonesia) done from visible images. |
 |
|
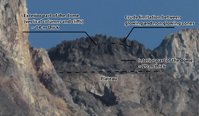
Additional photographs of the lava dome and the monitoring stations |
 |
|
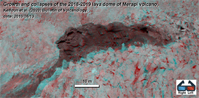
Movie of the last weeks of the lava dome growth done with anaglyphs calculated from the stereoscopic images of Somerapi1 and 3 (use blue and red glasses to see the relief). |
 |
|
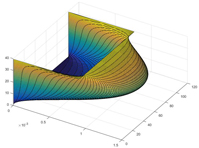
Code used with the software Matlab.
(1) viscous_profile_3D.m shows how the viscous profiles are calculated to relate the volume rate with the surface velocities. (2) VolcFlow_phase1_Fig7a and VolcFlow_phase2_Fig7b were used for Fig. 7. They must be used with Matlab and VolcFlow. Download VolcFlow here ( lmv.univ-bpclermont.fr/volcflow/), run VolcFlow in the command window of Matlab and load the input files. |
 |
|
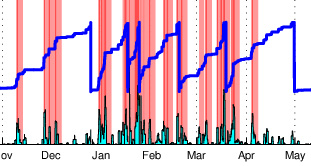
Weather station data of Pasar Bubar, close to the summit. The data cover the whole dome emplacement. No correlation has been identify between rainfalls and collapses |
 |
|
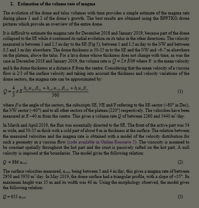
Details of the calculation of the cohesion of the lava dome and of the volume rate estimation from the measurement of the surface velocities. |
 |